
Master Excel Data Analytics with Power Query, Power Pivot & Dashboards Turn Raw Data into Automated Insights & Professional Dashboards
Stop Wasting Hours on Manual Excel Work
Presented by: Dr. Hesham Mokheimer
Course Overview
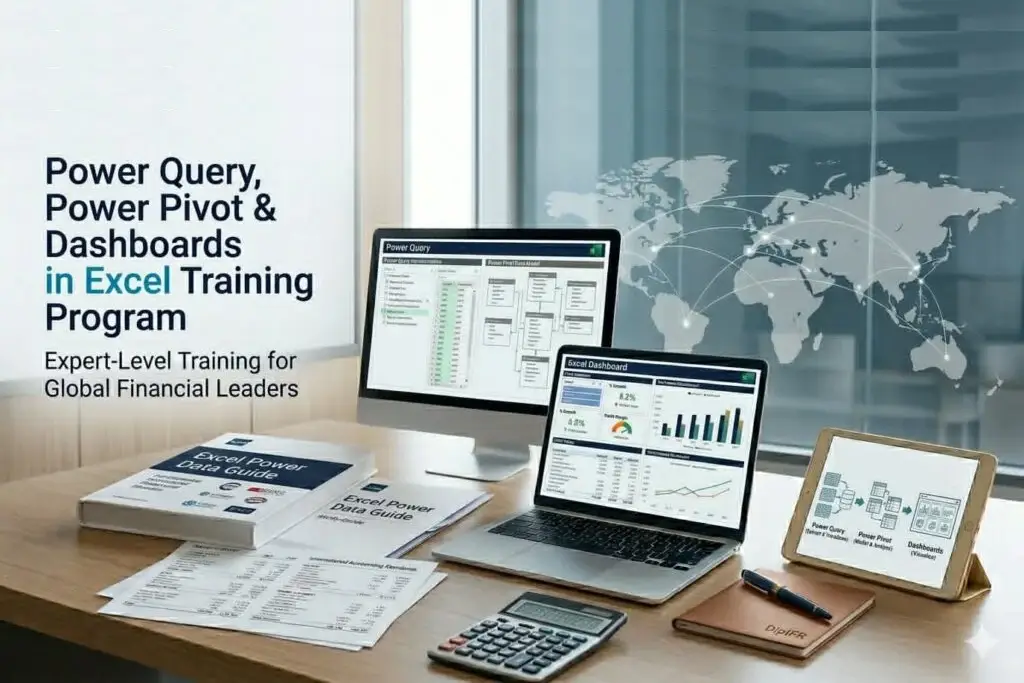
Most Excel users spend a huge amount of time copying data, cleaning files, combining reports, and preparing monthly reports manually. This course is designed to completely change the way you use Excel by introducing three powerful tools: - Power Query → Data cleaning and automation - Power Pivot → Data modeling and relationships - Dashboards → Data visualization and reporting
By the end of this course, you will be able to import data from multiple sources, clean and transform data automatically, build data models, and create interactive dashboards for reporting and analysis.
This course is highly practical and focuses on real business and finance reporting scenarios.
This course is highly practical and focuses on real business and finance reporting scenarios.
Course Details:
- e-Learning (Recorded Videos)
- 16h / 1 Min
Downloadable Materials:
PDF Files
Excel Sheets
Project Files
Downloadable Materials:
Flashcards
Excel Sheets
Project Files
Finance Professionals & Accountants
Financial Analysts
Auditors
Because in today’s business environment, IFRS is not tested in exams anymore
it is tested in boardrooms.
By the end of this course, you will be able to import data from multiple sources, clean and transform data automatically, build data models, and create interactive dashboards for reporting and analysis.
Why You Should Take This Course Not Just Excel… A Complete Reporting System
Master the tools that transform raw data into meaningful insights. This course equips you with practical skills in Power Query, Power Pivot, and Excel dashboards to automate reporting, analyze large datasets, and build professional, decision-ready reports. Move beyond manual work and become a data-driven professional.
If you work in finance, accounting, data analysis, reporting, or business analysis, you probably face these problems:
Monthly reports take too long
Data comes from multiple files
Data needs a lot of cleaning
Many manual steps in Excel
Reports need to be updated every month
Pivot tables become slow with large data
Difficult to build dashboards
Too many Excel formulas

This course will help you:
Automate data preparation
Combine multiple files automatically
Build data models instead of VLOOKUP
Work with large datasets
Create interactive dashboards
Reduce manual work
Build professional reports
Improve reporting efficiency
Become advanced Excel user
Who Should Attend This Course Designed for professionals who want to move from manual Excel work to automated reporting and data-driven decision making
Who Is This Course For?

Accountants

Financial Analysts

Finance Managers
Auditors

Business Analysts
Data Analysts
Reporting Specialists
Excel Users working with data
Anyone preparing reports in Excel
Anyone who wants to automate Excel work

Sales Professionals

HR Professionals

Supply Chain Professionals
Prerequisites -- Basic knowledge of Microsoft Excel (formulas, tables, basic functions) -- Familiarity with working on datasets (sorting, filtering, simple reporting) -- No prior knowledge of Power Query or Power Pivot is required
Skills You Will Gain Results That Drive Real Impact
By the End of This Course You Will Be Able To:
- Import data into Excel using Power Query
- Clean and transform data automatically
- Combine multiple Excel files into one dataset
- Remove duplicates and errors
- Unpivot and reshape data
- Build data models using Power Pivot
- Create relationships between tables
- Create calculated columns
- Create measures
- Use DAX formulas
- Build Pivot Tables from data model
- Create interactive dashboards
- Use slicers and timelines
- Automate monthly reports
- Build management dashboards
- Build financial dashboards
- Reduce manual Excel work significantly

Power Query, Pivot & Dashboards Course Outline
- Problems with traditional Excel reporting
- Manual reporting vs automated reporting
- Best practices for data cleansing (Practical guide and application, NO THEORIES!)
- Introduction to Power Query and Power Pivot
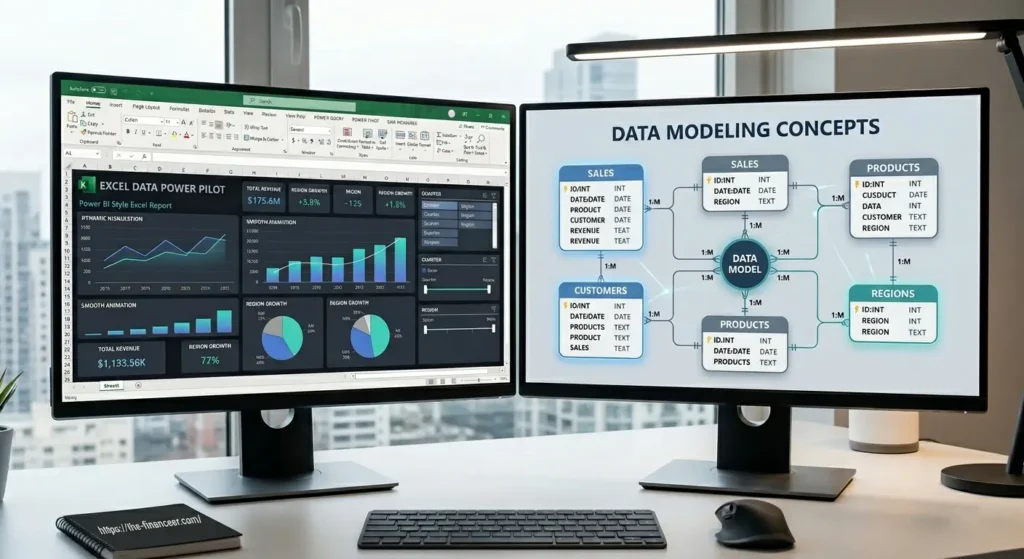
- Data structure and data modeling concepts
Using Power Query in Microsoft Excel:
- Import data from Excel files
- Import data from CSV files
- Import data from folders
- Combine multiple files
- Data cleaning
- Remove duplicates
- Replace values
- Split columns
- Merge columns
- Unpivot data
- Pivot data
- Data transformation
- Append queries
- Merge queries
- Create automated data refresh
- Build automated data preparation process
- Introduction to data model
- Relationships between tables
- Star schema concept
- Fact and dimension tables
- Calculated columns
- Measures
- Introduction to DAX
- SUM
- CALCULATE
- FILTER
- RELATED
- Time intelligence basics and ADVANCED DAX Functions
- Analytics and time series analysis and comparisons using DAX
- Building Pivot Tables from data model
- Dashboard design principles
- KPIs and metrics
- Pivot charts
- Slicers
- Timelines
- Interactive dashboards
- Financial dashboards
- Sales dashboards
- Management dashboards
- Formatting dashboards
- Layout and design
- Building full dashboard from scratch
- Automating monthly reports
- Updating dashboards
- Building reporting system in Excel
How the Course Is Delivered The course is highly practical and hands-on. Participants will work on real datasets and build dashboards step by step.
Training methodology includes:
- Step-by-step demonstrations
- Hands-on exercises
- Case studies
- Building dashboards from scratch
- Data cleaning exercises
- Data modeling exercises
- Automation exercises
- Real reporting scenarios
- Finance and business datasets
Participants will receive:
- Excel practice files
- Dashboard templates
- Data model examples
- Exercises and solutions
- Course materials
Who Should Attend This Course Designed for professionals who want to move from manual Excel work to automated reporting and data-driven decision making
--
Why You Should Take This Course
Course Content
Current Status
Price
Get Started
About Your Trainer – Hesham Mokhiemer
Hesham has extensive experience in training finance professionals, analysts, and business users on how to automate reporting processes, build data models, and create dashboards used for management reporting and business analysis. Through his training programs, he has trained more than 18,000 learners and professionals across different industries and organizations, helping them improve reporting efficiency and automate their Excel work.His training focuses on solving real business problems such as:
This course is delivered by Hesham Mokhiemer, a finance and data analytics trainer specialized in Excel automation, financial modeling, data analysis, dashboards, and reporting automation using Microsoft Excel, Power Query, and Power Pivot.In this course, Hesham teaches participants how to:

The objective of this course is not to teach Excel features only,
This course reflects Hesham’s professional training approach which focuses on automation, efficiency, data modeling, and dashboard-based reporting instead of traditional manual Excel work.
Invest in Your Future
Included in Fees
Need Personal Guidance? Book your session or connect with our consultant for immediate support.
Trusted by professionals
across the region
138 LinkedIn recommendations from finance professionals, auditors, and trainees across Saudi Arabia and beyond.
Worked with Hesham?
Share your experience on LinkedIn and it may appear here.
Write a recommendationLet's Discuss Your Training Needs Not sure which program best fits your organization?
Your organization's training objectives
Course customization options
Scheduling and quotation
Recommended learning path
Delivery format (Classroom / Virtual)
No obligation • 30 minutes • Online Meeting
See What You’ll Master From Data Preparation to Professional Dashboards - Build Skills You Can Use Immediately
What they said?
Uncover Insights: Interact with the Live Data
Frequently Asked Questions
No, the course starts from basics and moves to advanced level.
Yes, very practical with datasets and dashboard projects.
Yes, multiple dashboards and a full project.
Yes, including CALCULATE, FILTER, and time intelligence and a LOT MORE!
Basic Excel knowledge is recommended.